You Are Paying 100% Salaries for 10% Asset Utilization: The “Chai-Paani” Trap
by
December 19, 2025
You Are Paying 100% Salaries for 10% Asset Utilization: The “Chai-Paani” Trap
Your dashboard is lying to you. I don’t mean the numbers are fake. I mean the story they tell is a fiction we comfortably buy into because the alternative is too messy to confront. Here is a scenario I see in boardrooms across Mumbai and Delhi every month: The dashboard shows 500 market visits. The GPS tracking confirms movement. The attendance is 100%. But your P&L shows only 50 outcomes. The gap isn’t “market conditions.” It isn’t “competitor discounting.” It is the most expensive line item on your balance sheet: The Illusion of Busyness.
The Gap Between Academic Potential and Execution Reality
We recently audited a mid-sized consumer brand in Delhi. On paper—the “academic” view—they looked healthy. Their beat plans were full, their territories were assigned, and their reps were clocking in daily.
But when we deployed our field intelligence tools to crunch the data behind the visits, we found a disturbing reality hiding in the averages. We call it the gap between having a sales team and utilizing one.
Here is what was actually happening on the ground.
1. The “Chai-Paani” Trap
The data showed reps were visiting the same 500+ outlets repeatedly. These were outlets that hadn’t placed a significant order in months. Why go back? Because it’s comfortable.
We did market working with the client’s team to witness the interaction. It usually went like this:
Retailer:“Arre Sharma ji, pichle hafte hi toh stock liya tha. Aaj rehne do.” (Stocked up last week, let it be today.)
Sales Rep:“Koi baat nahi Sir, bas chai peene aa gaya tha. Attendance bhi lag jayegi.” (No problem, just came for tea. Will mark my attendance too.)
This interaction is fatal to your ROI. You are paying full salaries, fuel, and allowances for “social visits,” not sales calls. The asset (the salesperson) is fully deployed, but the utilization (revenue generation) is near zero.
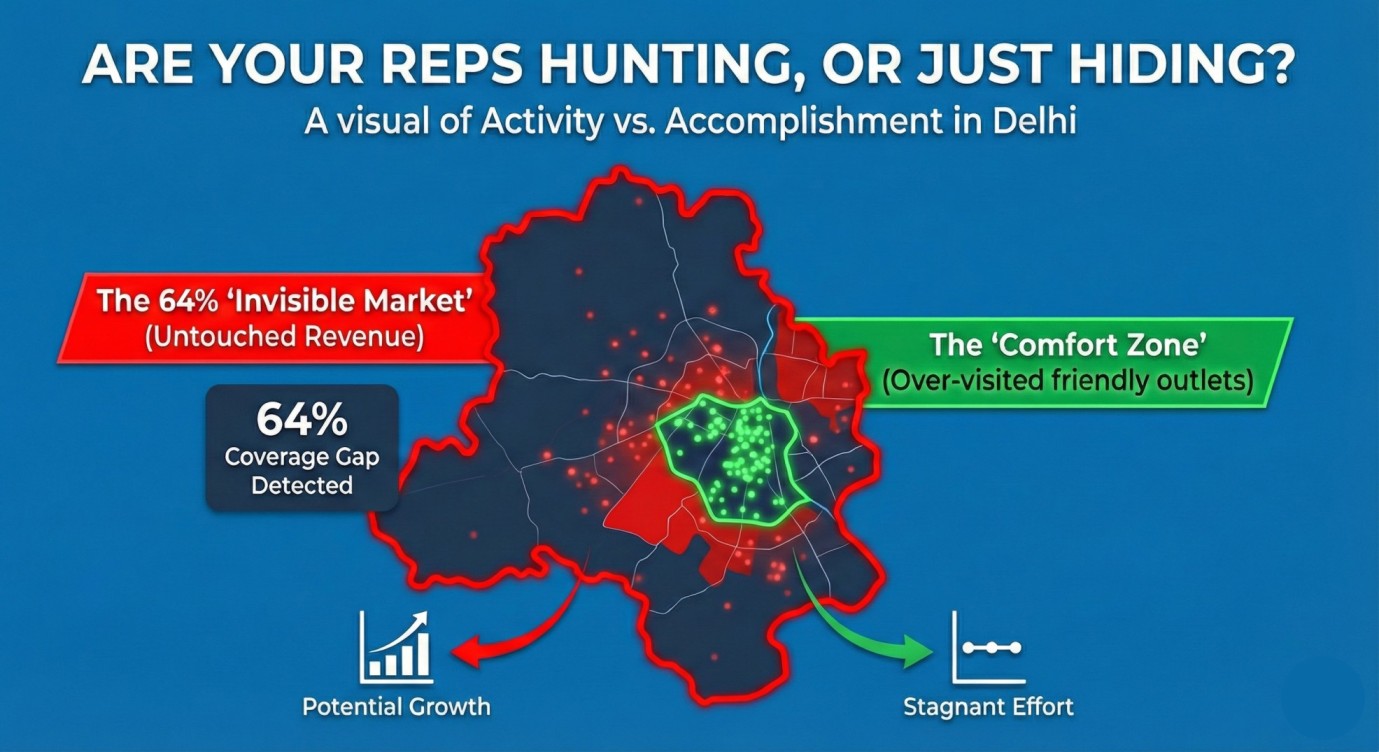
2. The “Invisible” Market
While the team was busy drinking tea with non-buying retailers, they were ignoring the goldmine next door.
Delhi has roughly 250 wards. The client’s team was covering less than 50% of them. In Central Delhi specifically, 64% of the market was completely untouched.
When we questioned the field managers, the typical defense mechanism kicked in: “Sir, wahan demand nahi hai. Wahan koi distributor ready nahi hota.” (There’s no demand there. No distributor is ready.)
But the data proved the demand was there. The will to go there wasn’t. It is easier to visit a friend than to pitch a stranger.
The Pivot: From Activity to Impact
Most founders try to solve this with “motivation” or “more training.” We took a different approach. We didn’t try to inspire them; we changed the physics of their workday.
We Stopped the "Bas Milne Aaya Tha"
We analyzed the route data and cut visit frequency by 35% for low-velocity/non-buying stores. We removed the option to loiter.
We Forced the Hunt
We redirected that saved time strictly into the 55% “White Space” zones—the wards that had been ignored. We assigned specific targets for new outlet coverage, not just existing outlet maintenance.
We Changed the Metric
We stopped tracking “Visits.” Anyone can visit. We started tracking “Productive Calls (PC%)”. If you visit and don’t sell (or collect meaningful data), it doesn’t count as a win.